One of the most interesting aspects of Semantic Mediawiki is the data to chart integration, done though the Semantic Result Formats extension, and using the Jqplotchart and Jqplotseries formats, which in itself are based on jqPlot.
However, it’s documentation and code examples are not as thorough as one can expect.
Requirements
To start with, just make sure you have all the proper extensions installed, namelly:
- Mediawiki version prior to 1.21(*) (1.20.6 is OK)
- Semantic Mediawiki 1.8 – Both SWM and SRF are undergoing some changes, so it’s better to keep a specific version.
- Semantic Results Formats 1.8
(*) There are some reports of problems with mediawiki 1.21, which I don’t wan’t to go though right now, so to make thing simpler, just avoid this version.
Then, let’s create some data to test with. To make things easier, I created a mostly self contained wiki page with most code here. But lets go through all steps:
Create data
I created a series of sub objects which contain dummy data. The reason for the sub objects is simple: in order to create a single page with all test data, otherwise it won’t work on some charts, as some charts need data on a vert specific format. Here goes the test data:
[[Category:Demo]]
{{#subobject:
|HasStatistic=1
|statisticNetwork=Demo
|HasStatisticName=label 1
|HasStatisticValue=100
|HasStatisticValue1=120
|HasStatisticValue2=130
}}

{{#subobject:
|HasStatistic=1
|statisticNetwork=Demo
|HasStatisticName=label 2
|HasStatisticValue=50
|HasStatisticValue1=60
|HasStatisticValue2=90
}}

{{#subobject:
|HasStatistic=1
|statisticNetwork=Demo
|HasStatisticName=label 3
|HasStatisticValue=70
|HasStatisticValue1=50
|HasStatisticValue2=55
}}

{{#subobject:
|HasStatistic=1
|statisticNetwork=Demo
|HasStatisticName=label 4
|HasStatisticValue=130
|HasStatisticValue1=90
|HasStatisticValue2=40
}}
These sub objects represent data with the following format:
[table id=1 /]
Then, let’s make sure that the installation was successful. For that I recommend you to use some proven and contained code, such as on this page. Just copy-past the code to your SMW instance, set the proper properties types and see the charts appear. One note though: don’t use the preview until you saved the first time, as the subobjects need to *actually exist* for the charts to have content.
Basic Charts
Bar Chart
To start, let’s use a Bar Chart. This chart needs data on the following format:
[table id=3 /]
And specifically, though this query
{{#ask:[[statisticNetwork::Demo]]
 |?HasStatisticName
 |?HasStatisticValue
 |mainlabel=-
 }}
we get the following table
[table id=2 /]
Now, creating the chart, with the following code
{{#ask:[[statisticNetwork::Demo]]
|?HasStatisticName
|?HasStatisticValue
|format=jqplotchart
|link=all
|headers=show
|charttitle=Chart Title demo
|charttext=Chart Description Text
|mainlabel=-
|searchlabel=… further results
|distributionsort=none
|direction=vertical
|numbersaxislabel=Some Label
|height=400
|width=50%
|valueformat=%d
|ticklabels=1
|theme=simple
|colorscheme=rdbu
|filling=1
|chartlegend=none
|datalabels=percent
|charttype=bar
}}
Which results on this chart:
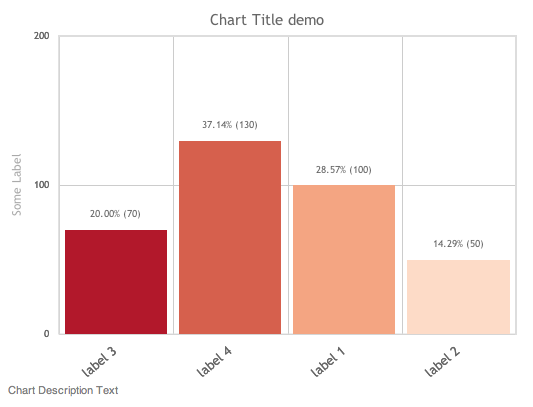
This can also be seen on a live wiki, here.
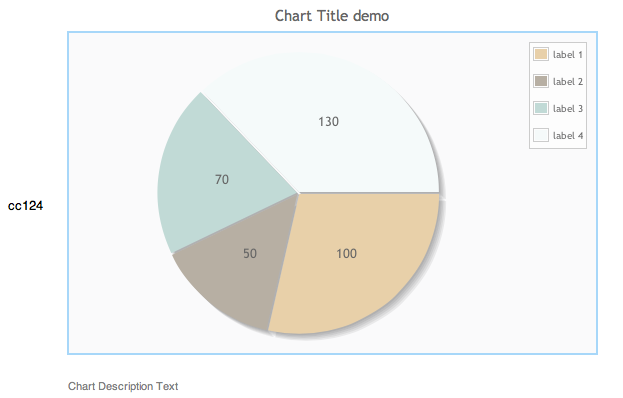
Donut Chart
The donut chart can use mostly the same parameters as the bar chart, and on this specific case it can use the same data table. So using the following code:
{{#ask:[[statisticNetwork::Demo]]
|?HasStatisticName
|?HasStatisticValue
|width=50%
|format=jqplotchart
|charttype=donut
|direction=horizontal
|mainlabel=-
|limit=20
|link=all
|headers=show
|charttitle=Chart Title demo
|charttext=Chart Description Text
|highlighter=yes
|datalabels=value
|valueformat=%d
|theme=simple
|colorscheme=rdbu
|chartlegend=ne
|sort=HasStatisticName
|order=asc
}}
Will result on this chart:

Again, this can also be seen on a live wiki, here.
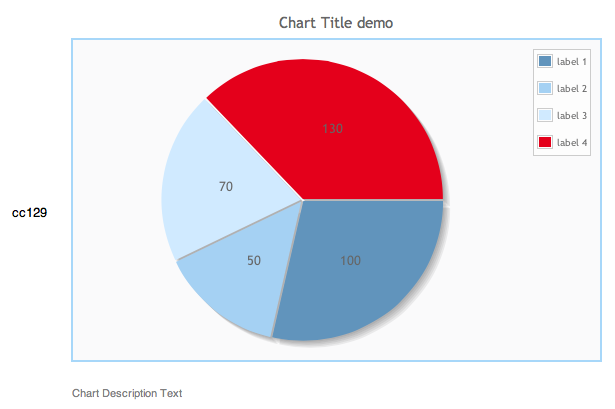
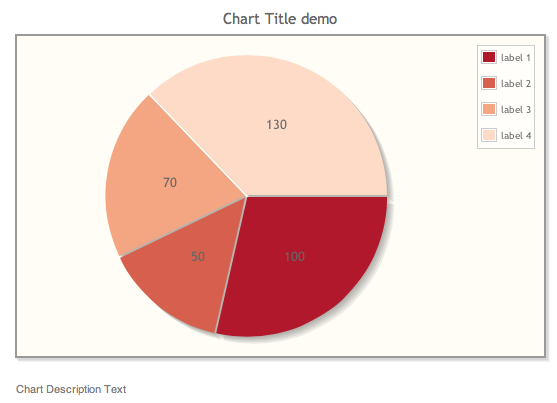
Pie Chart
For the Pie Chart, it’s simply a matter of changing one (or two) parameters.
{{#ask:[[statisticNetwork::Demo]]
|?HasStatisticName
|?HasStatisticValue
|width=50%
|format=jqplotchart
|charttype=pie
|direction=horizontal
|mainlabel=-
|limit=20
|link=all
|headers=show
|charttitle=Chart Title demo
|charttext=Chart Description Text
|highlighter=yes
|datalabels=value
|valueformat=%d
|theme=simple
|colorscheme=rdbu
|chartlegend=ne
|sort=HasStatisticName
|order=asc
}} 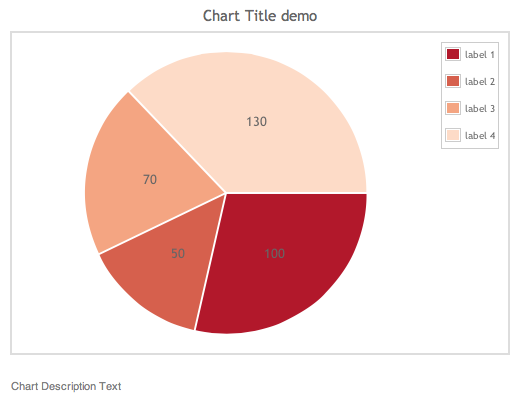
And adding the option filling=no will result on this.

Again, this can also be seen on a live wiki, here.
Line Chart
Line charts should also be trivial to implement, and they are, if you only have one series of values. Otherwise, things can get a little bit complex. Jqplotseries is precisely what is needed to support more than one series, otherwise Jqplotchart and Jqplotseries is mostly interchangeable and seamless.
To start with, instead of using jqplotchart, jpplotseries must be used in order to support multiple series. Also, series need to be specifically aggregated otherwise it tries to aggregate subobjects, which won’t work. A test page of a series of different parameters can be found here.
Anyways, the end result table is the following:
[table id=4 /]
And, then, this code make magic happen:
{{#ask:[[statisticNetwork::Demo]]
|?HasStatisticName
|?HasStatisticValue=test 1
|?HasStatisticValue1=test 2
|?HasStatisticValue2=test 3
|width=40%
|format= jqplotseries
|charttype=line
|direction=vertical
|mainlabel=-
|limit=20
|link=all
|headers=show
|charttitle=Chart Title demo
|charttext=Chart Description Text
|highlighter=yes
|datalabels=value
|valueformat=%d
|theme=simple
|colorscheme=rdbu
|chartlegend=ne
|group=property
|sort=HasStatisticName
|order=asc
}}
Resulting on this chart:
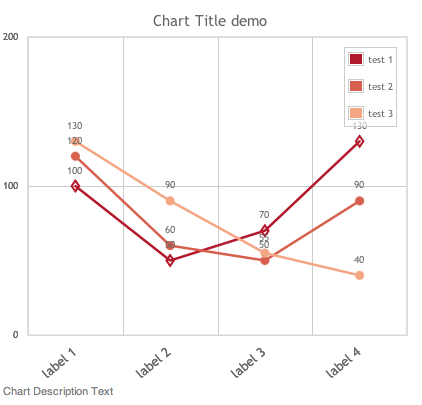
Again, this can also be seen on a live wiki, here.
However, there a few Jplot features which are not available from SMR:
- Line markers cannot be set, and are randomly selected;
- Series’ color cannot be individually set. However, color schemes can be used to try to overcome this limitation.
Optional settings
There are a few more setting related to Jqplotchart and Jqplotseries, but will only focus for the ones which can be more frequently used.
Themes
The first manner to set the look and feel of a chart is through the use of preset themes. As of version 1.8 (and 1.9) there are only 3 themes available: none, simple and vector. Those are set by using the “theme” parameter, with the following results:
None
 Simple
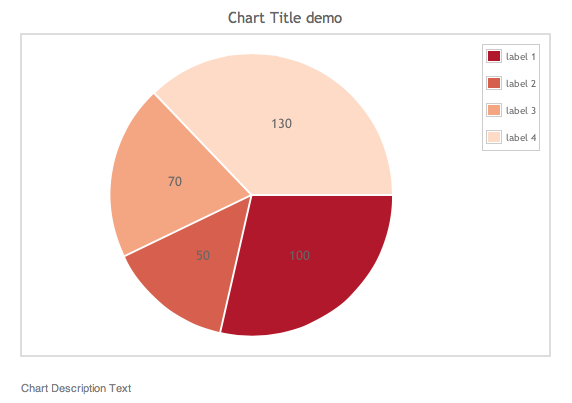 Vector
Again, this can also be seen on a live wiki, here.
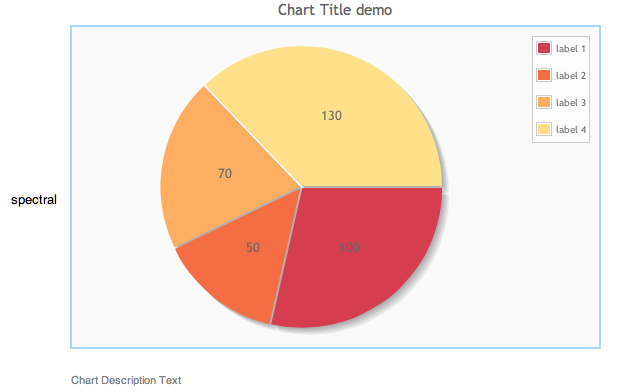
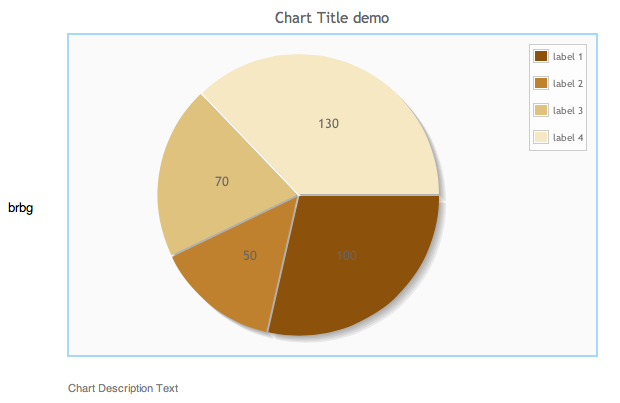
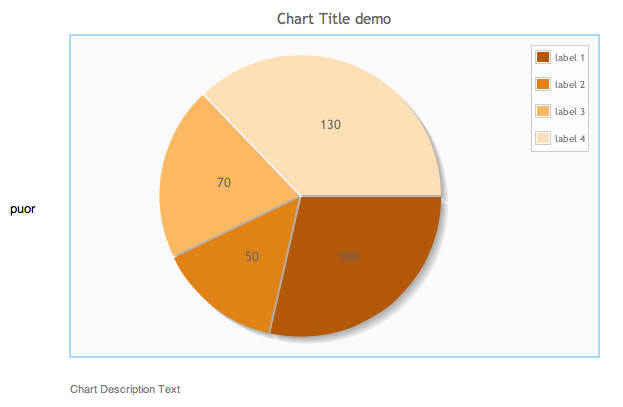
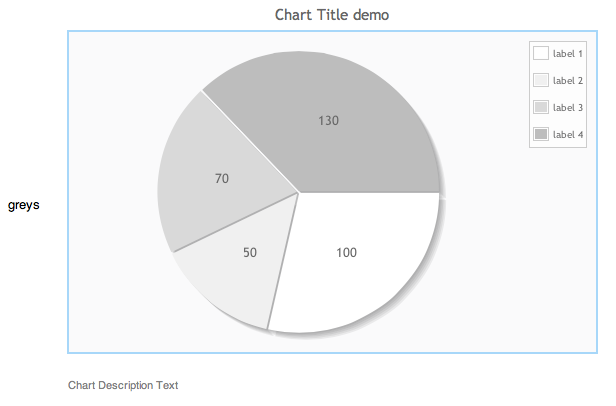
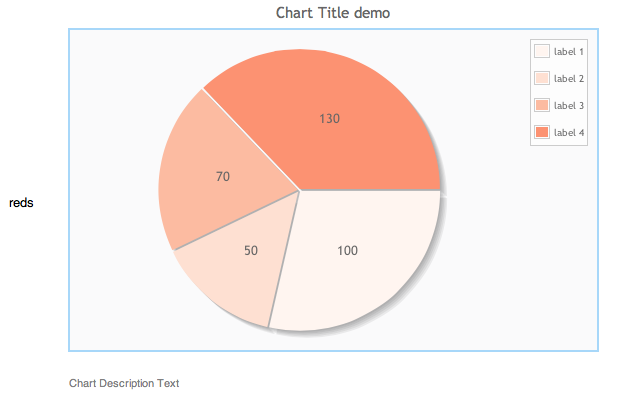
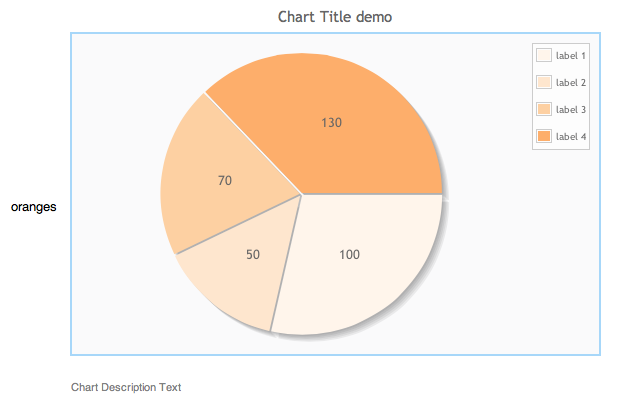
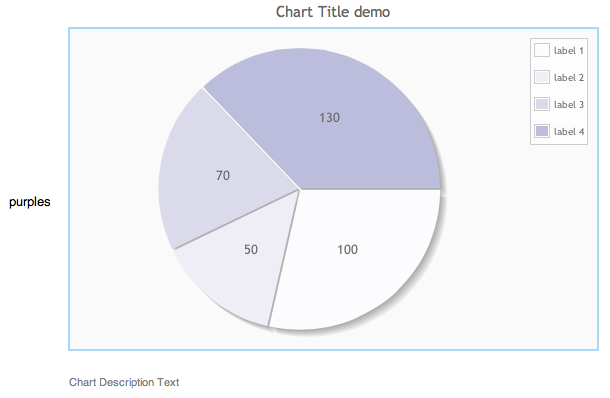
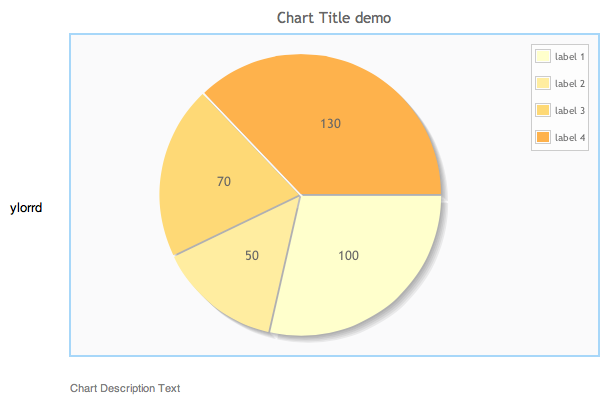
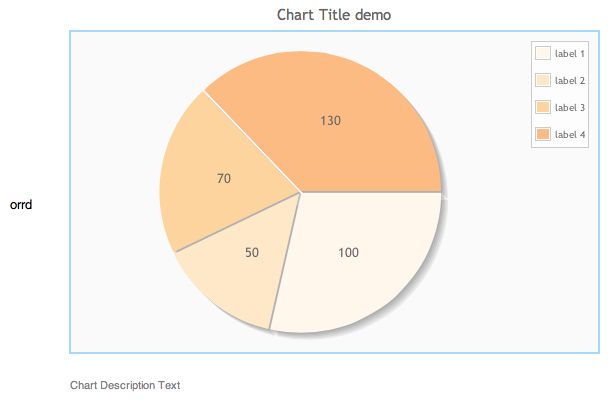
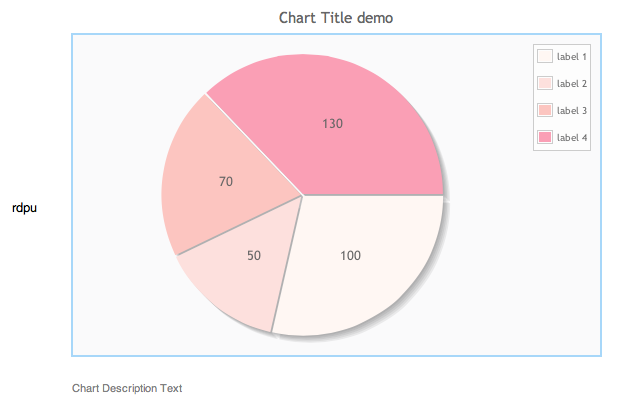
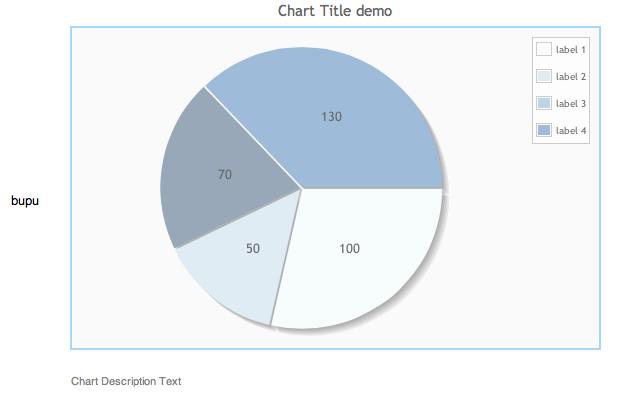
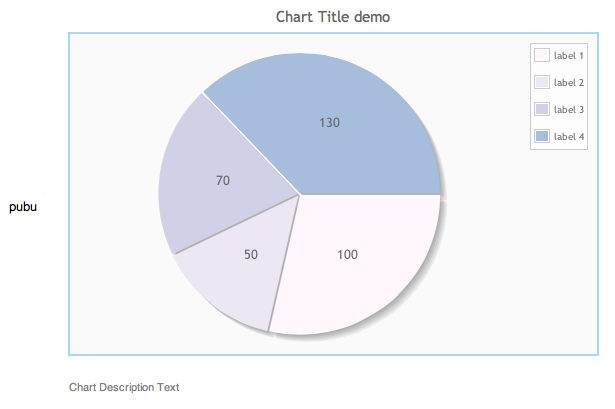
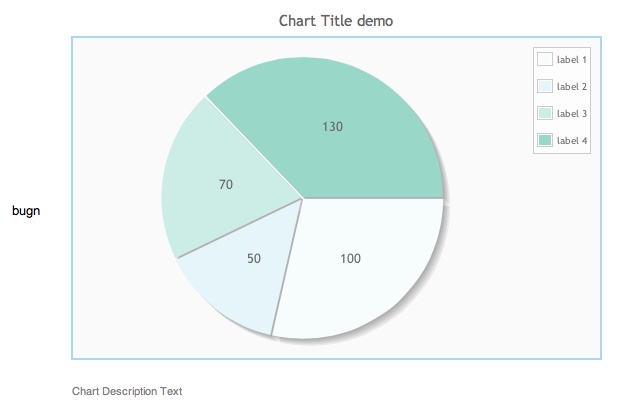
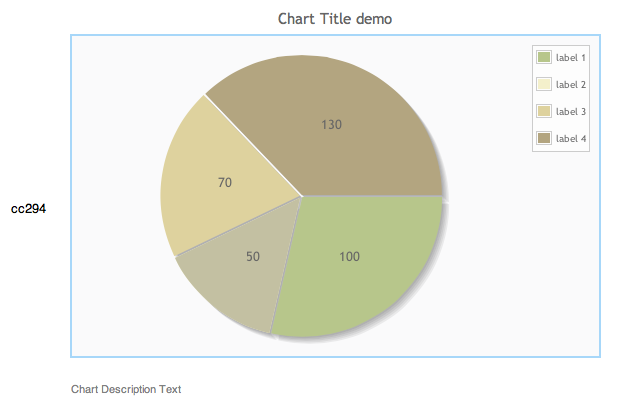
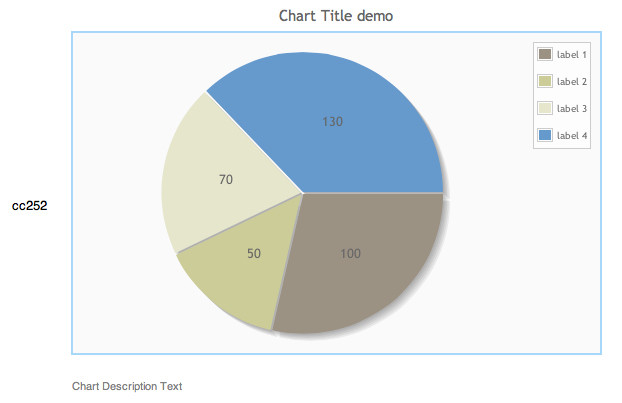
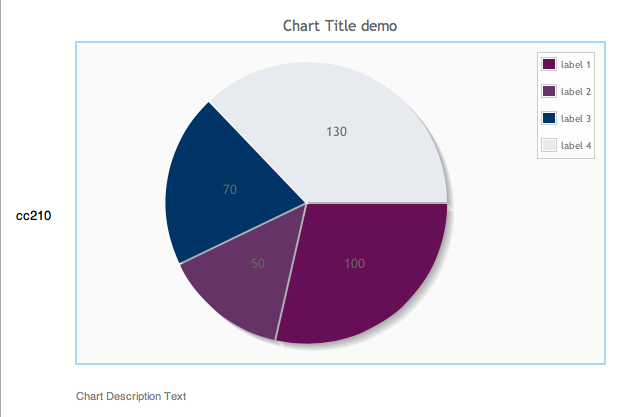
Color schemes
The easier way to set a different look to a chart, is to select a color schemes, through the colorscheme parameter. Below you can find all the colour schemes available on SWR 1.8 and 1.9. Also, this can also be seen on a live wiki, here, but beware as loading a large number of charts can be quite CPU intensive a take a couple os extra seconds to render properly.