
Obtaining the Infection Fatality Rate
On the past two weeks two most important studies were made public. One from the Public Health Agency of Sweden1 reporting the calculated real infection fatality rate of Covid-19 in Stockholm, and another from the MIT2 . Both having the same goal: estimating the real infection fatality rate (IFR). This corresponds to the odds of dying from the disease, including those who have mild or no symptoms. How does this differ from the values reported by official figures? Official figures only include the number of people having been tested positive. And people without symptoms, nor with a known contact with another person having tested positive, don’t often get tested, unless it gets into a random population study. With this in mind, the ratio you get with the current figures is known as Case Fatality Rate (CFR), which corresponds to the number of fatalities based on the number of known infections.
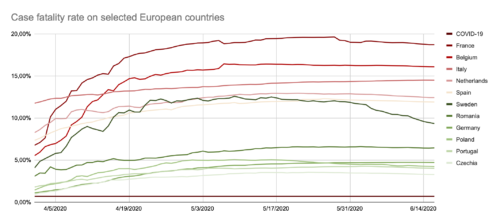
Data Source: European Center for Disease Prevention and Control
Click to enlarge.
Knowing the number of how many people went undetected is what allows you to calculate the most import indicator of a pandemic disease: the actual fatality rate. Countries with the lowest CFR puts it at around 3.9%, such as Czechia, where others, such as Italy or Belgium exceeds 10%. So, from the early days, scientific evidente suggested that there were a very high number of asymptomatics within the overall population, we just didn’t know exactly how many. However, such a marked differences in fatality rates strongly suggests the number on undiagnosed people are very different on all those countries. Also, keeping track of this indicator aallows authorities of how accurate is the current testing and tracking COVID-19 on the overall society, assuming all other things being equal. So, as a rule of thumb, the closer you are to the disease’s IFR, the lower the number of undiagnosed people you let slip, the easier it gets to keep track of infection chains. The more distant you are, the harder it gets to control it.
Now, the IFR of a disease is kept mostly constant, while the healthcare level is maintained. This means that knowing the IFR can be used to calculate the real number of infected, if you assume the same level of healthcare and demographics, which is a fair assumption within most European countries, except perhaps Italy and Spain, whose health systems were strained to the limit, or even beyond.
In order to calculate the IFR you need to know two things: how many people got infected, and many died from it. Knowing how many died from it should be strait forward, unless it’s not. All EU countries know exactly how many people died within a given span of time, but knowing how many of those died from Covid-19 isn’t that simple. In order to achieve that goal, three methods are used:
- Throughly testing any suspected death for the presence of the virus, and compare it with the cause of death. If the cause of death can be linked to the virus, that was likely a Covid-19 fatality. These tests can be done before or after the actual death.
- Report only based on the symptoms at time of death, which if linked to an already established positive case, and also be considered as a Covid-19 fatality.
- Identify if the current number of fatalities nationwide is consistent with the past year’s average, also known as Excessive Fatality. This indicator is both the most inaccurate, and the most important, as it’s unable to tell exactly how many people died from it, but at the same time, allows to measure the accuracy of all the other methods.
Calculating the real number of infections from Covid-19 takes two parameters: IFR, as described above, and the number of fatalities.
The reported reality
Current figures are based on tested patients, and where the different testing methods start to appear. Some countries only test patients with severe symptoms as they’re admitted to hospital, others only require patients to show mild symptoms, and finally others test everyone that wants to be tested, regardless whether that person exhibits symptoms, was in contact with a positive case, or just blanket testing. That’s why only looking at the number of known infections is of limited use at best.
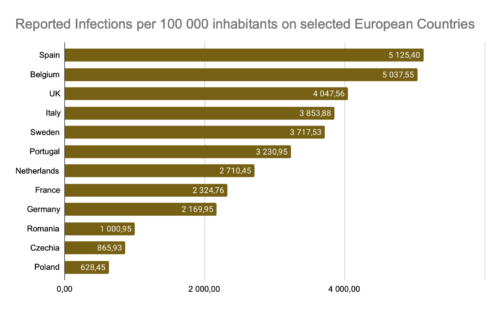
Data Source: European Center for Disease Prevention and Control
Click to enlarge
Nevertheless, in order to maintain the bare minimum usefulness, we need to look at infections per capita in order to compare between countries.
Looking at that perspective results on the following ranking, while using the same small list of European countries. What is most striking, and which underlines the need to know the real number of infections, is that countries with most fatalities are not exclusively occupying the top spots. France is the most glaring case. France and Germany report similar infections per capita, but the reality is that France has four times the fatalities per capita of Germany. This demonstrate the level of France’s underreporting of infections. Other example is Belgium, which is the undisputed world leader in deaths per capita but appears in second place.
The real number of infections
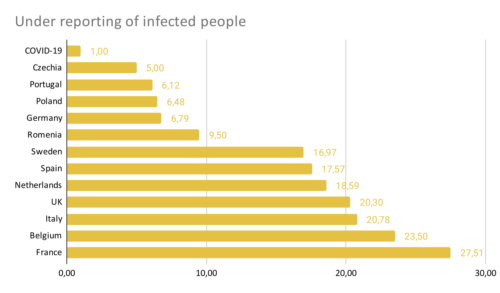
Own calculations.
Click to enlarge
Using the IFR and number of fatalities of each of the including countries paints a very different really than what is recognised by each of the governments.
The level of under reporting is extremely high on some values, which explain the discrepancies identified above, and specially between Germany and France. Germany’s under reporting is one of the lowest, and yet it reaches 6.79. This means, that even on a well managed pandemic, Germany has almost 7 times more infections it is aware of.
This under reporting can also be interpreted as “How close is the reporting figures with reality”, including how successful is the testing processes. Here, the smaller countries show a significant advantage: Czechia and Portugal take the top spots, while Poland, which is significantly bigger, took thrill.
Own calculation
Click to enlarge
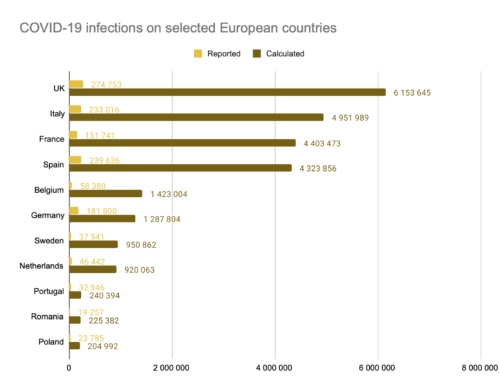
If we translate the under reporting rate into absolute figures, we obtain the chart in the left.
The UK become the European country with the highest infection count, at approximately 6.1 million, followed by Italy with 4.95 million and France with 4.4 million.
Looking at the per capita figures, a dangerous new world is made apparent.
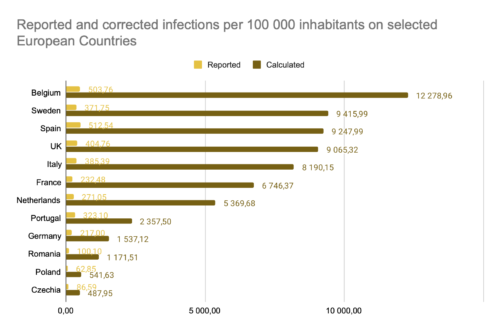
Data Source: European Center for Disease Prevention and Control
Own calculation
As expected, Belgium appears on the top spot, but the figure is eye opening: 12% of the population was likely already infected. Then the country everyone bashed for the past months, Sweden. with 9%. Sweden as the fifth county with most reported infections, but it’s known that Sweden for far too long only tested severe cases prior from being accepted into hospital. However, this seems to be changing, as the CFR value is now decreasing, from the April peak.
Next, Spain, the UK and Italy, all with more than 8% of the population.
The most visible diferences lies on the relative positions of France and Portugal. On the French case, it jumped a few positions, whereas on the Portuguese case it lowered a few positions, and this now at a level between Germany and the Netherlands.
This all goes to demonstrate that the daily figures reported by the official agencies don’t tell the whole story. In most cases, it only represents a fraction of it. On the worst case, it’s an order of magnitude off. As such measures such as the one taken by the UK government to measure traveling risk to certain destinations based on reported infections is flawed to say the least.
- The infection fatality rate of COVID-19 in Stockholm – Technical report [↩]
- Rahmandad, Hazhir and Lim, Tse Yang and Sterman, John, Estimating the Global Spread of COVID-19 June 24, 2020. Available at SSRN: https://ssrn.com/abstract=3635047 [↩]